Report of database usage in 2010
USING OF NATURE OBSERVATIONS DATABASE IN 2010
In 2010, users submitted 2,326 observations to the Nature
Observations Database. It is the best result since beginning of active using in 2008. This map shows distribution of inserted observations
in 2010.

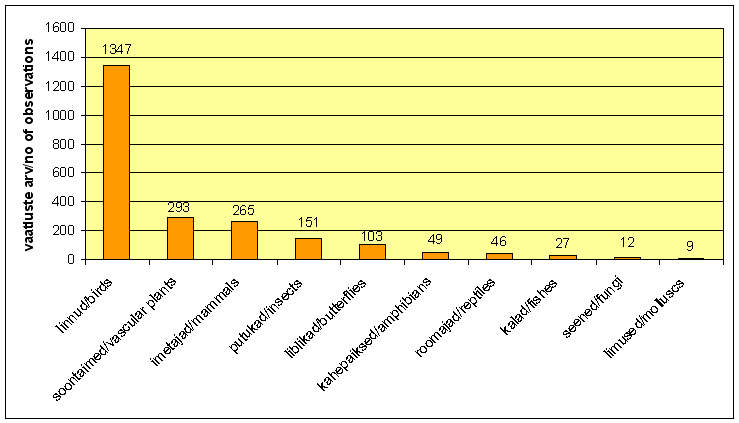
By groups of species inserted observations divided as
follow (here are only TOP 10 of species groups):
1) birds - 1347 observations,
2) vascular plants - 293 observations,
3) mammals - 265 observations,
4) insects (not include butterflies) - 151 observations,
5) butterflies - 103 observations,
6) amphibians - 49 observations,
7) reptiles - 46 observations,
8) fishes - 27 observations,
9) fungi - 12 observations,
10) molluscs - 9 observations.
The most popular species which observations were entered were:
White stork (Ciconia ciconia) 179 times, followed Common
crane (Grus grus) 73 times, Roe deer (Capreolus capreolus) 64 times, Red fox (Vulpes
vulpes) 42 times, Buzzard (Buteo buteo) 36 times and Whooper swan (Cygnus cygnus) 33 times. The first 14 most seen species were mammals and birds. The most seen not mammals and birds were Common toad (Bufo bufo) 22 observations, Mezereon (Daphne mezereum) 21 observations ja adder (Vipera berus) 18 observations.
Observations of species, which are under nature
conservation in Estonia numbered 937. 806 of them have been confirmed: 26 of
these were observations of species under protection category I , 94 under
protection category II and 686 under protection category III. Comparing by 2009 number of observations of protected species increased almost 2 times. It was thanks by competition of protected species observations which was organized because of International Year of Biodiversity 2010.
139 persons entered their observations to the Nature
Observations Database in 2010. 85 of them inserted three or more
observations and 59 of them inserted more than 10 observations. It was not more than in 2009.
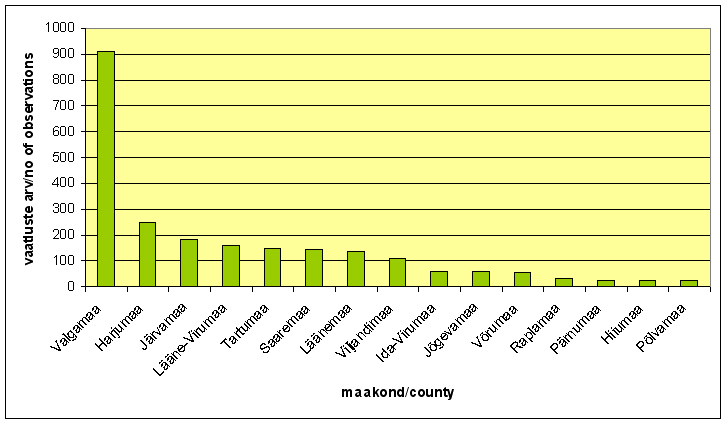
By county: users entered more than 100 observations to
the Nature Observations Database from eight counties: Valga (912), Harju (250),
Järva (182), Lääne-Viru (157), Tartu (149), Saare (145), Lääne (137) and Viljandi
(109).
Observations submitted to the database were more frequent
in spring. The biggest number of inputs was in May (718) and April (614) and March (279)
(see the next graph).
